
Page 89 - KEF-23-Bericht-Flipbook
P. 89
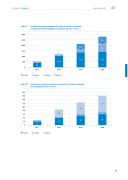
23. Bericht | Kapitel 4 Leistungsbericht Abb. 27 3.000 2.500 2.000 1.500 1.000 500 0 YouTube Abb. 28 180 160 140 120 100 80 60 40 20 0 YouTube Aufrufe (Views) der Angebote von funk auf YouTube, Facebook, Instagram (ohne Bewegtbild) und Snapchat pro Jahr (in Mio.) 140 2017 Facebook Instagram 15 129 2018 2019 2020 Snapchat 657 40 521 29 685 206 1.040 1.371 1.416 396 Interaktionen mit den Angeboten von funk auf YouTube, Facebook und Instagram pro Jahr (in Mio.) 40 6 8 6 64 87 14 39 52 60 20 2017 2018 2019 2020 Facebook Instagram 87
